Interest Rate Effects on Buyer Financing for Sub-$50M Deals
Higher rates force lenders to dictate deal terms, squeezing valuations regardless of buyer intent.

Interest rates didn't shut down the market for business sales below the lower middle market threshold in 2026. What they did was force every deal in that range through a narrower structural funnel, one where the buyer's lender, not the buyer's ambition, decides what a business is actually worth at closing. The Fed held rates steady in January 2026, with Prime at 6.75% after the cuts late in 2025 gave everyone a brief taste of relief. That's not a crisis rate. But it's a plateau high enough that an SBA buyer who financed at roughly 6% back in 2021 is now looking at variable 7(a) rates running 9% to 11.5%, and that gap changes the math on every offer that crosses a seller's desk.
One way to frame the shift: rates stopped being a gate that deals pass through or don't, and became a set of dials that get turned instead. Larger strategic buyers and private equity firms with balance sheet depth can absorb the cost of expensive debt across a portfolio, or lean on relationships with syndicated lenders who have room to negotiate. Sub-threshold buyers, the owner-operators, search fund principals, and regional PE platforms who make up the bulk of this market, don't have that luxury. There's no hedge, no dry powder sitting on the sidelines, no access to a syndicated loan desk willing to smooth out a rough quarter. Every basis point lands directly on the term sheet.
None of this means deals have stopped happening. They haven't stopped happening, but what's changed is the shape of them, and sellers who walk into 2026 negotiations expecting 2021 terms are going to negotiate against their own interests without realizing it. What's changed is the shape of them, and sellers who walk into 2026 negotiations expecting 2021 terms are going to negotiate against their own interests without realizing it.
What the financing stack looks like across the sub-$50M range in 2026
Talk about "the sub-$50 million market" as if it's one thing, and the numbers stop making sense fast. It's four markets, stacked on top of each other by deal size, and each one runs on a different lender type, a different leverage ceiling, and a different equity ask from the buyer. It's four, stacked on top of each other by deal size, and each one runs on a different lender type, a different leverage ceiling, and a different equity ask from the buyer.
Below the low end of the lower middle market, SBA 7(a) financing dominates almost entirely. The program provides substantial loan guarantees, but it comes with real qualification hurdles: 10% buyer equity in actual cash, no borrowed funds allowed to fill that gap, a FICO score of 680 or higher, and at least two years of relevant management or industry experience. The target business has to show two years of consistent positive cash flow, and the debt service coverage ratio has to clear 1.25x. As of Q2 2026, the median rate on disbursed SBA 7(a) acquisition loans sat at 8.75% (Prime plus 2.00%), based on 826 loans. Looking across the full FY2025 to 2026 window, the average rate on 8,678 acquisition loans came in at 9.31%, with a median of 9.50% and an average loan size of $1,175,340. Most borrowers pay between 7.75% and 10.5%, adjusting quarterly as Prime moves. SBA rules also allow a seller note, up to 5% of the purchase price, to count toward that 10% equity requirement, which matters more now than it did when rates were low and buyers had more cash cushion to spare.
Move into the next tier up, and regional banks and business development companies take over. Senior debt typically runs to a moderate multiple of EBITDA, buyer equity climbs meaningfully, seller financing commonly fills a portion of the gap, and an earnout may account for additional consideration on top.
In the tier above that, mezzanine debt enters the stack alongside senior debt. Senior lenders extend to several turns of EBITDA, mezz adds further leverage, buyer equity rises to a meaningful share of the capital stack, and seller financing and earnouts fill in similar ranges as the tier below.
At the upper end of the lower middle market, the structure starts looking like a small-scale version of a PE buyout. Senior debt still runs 3 to 4 times a company's earnings base, mezzanine adds 1 to 2 turns, buyer equity climbs to a substantial portion of the deal, and rollover equity appears in a share of deals led by a private investment firm. Right at that upper boundary, senior debt is pricing at SOFR plus 450 to 650 basis points, which works out to roughly 9% to 11% all-in. Leverage caps for LBOs in 2026 have pulled back meaningfully from the peaks reached during the low-rate years.
The capital stack gets more layered as deal size grows, sure. But rate pressure runs through all four tiers the same way. What changes isn't whether the pressure exists, it's which instrument in the stack ends up absorbing it.
How the DSCR ceiling converts higher rates into lower purchase prices
Run the arithmetic on a mid-sized note over ten years, comparing a 6% rate against 10.5%, and the difference comes out to a meaningful increase in monthly debt service. That $7,000 has to come from somewhere. It can't come from the lender, who's already collecting it. It can't come from the buyer's pocket indefinitely, not without blowing past what the business can support. So it comes out of the purchase price.
The debt service coverage ratio requirement acts as a hard ceiling on valuation, not merely an abstraction. A lender requiring 1.25x DSCR isn't making a judgment call about how motivated the buyer seems or how well the pitch deck reads. The math either clears the bar or it doesn't. If projected cash flow can't service the proposed debt load at that coverage ratio, the loan amount shrinks, and if the loan amount shrinks, the offer price shrinks with it, regardless of what the buyer might otherwise be willing to pay.
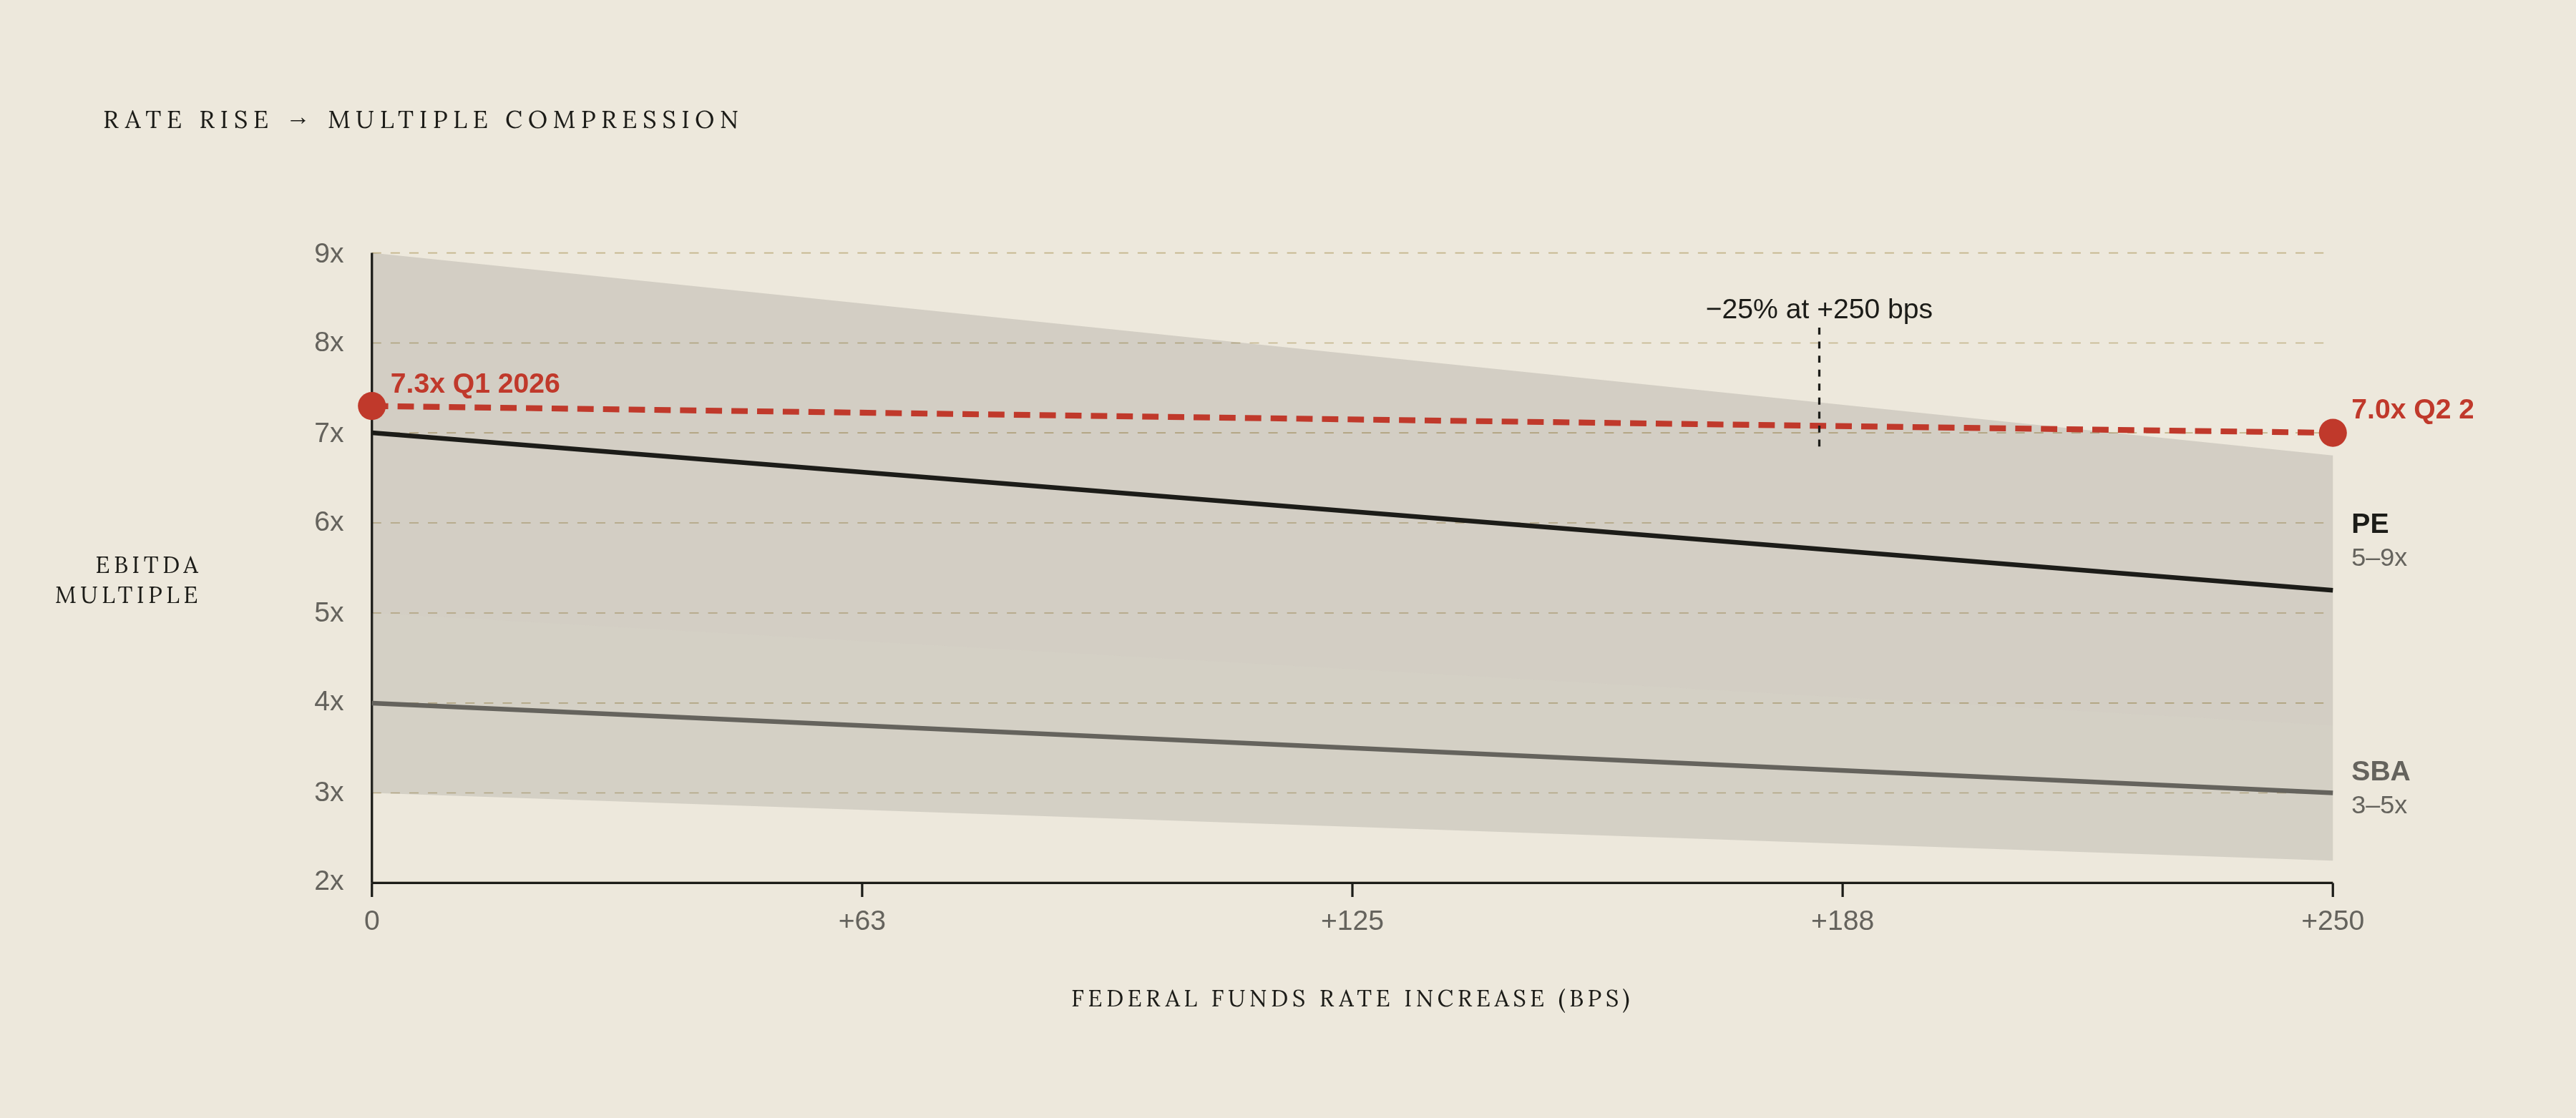
Quantpillar's analysis of the rate-to-multiple relationship finds that a 250-basis-point increase in the federal funds rate corresponds to roughly a 25% decrease in EBITDA multiples for debt-free businesses. For leveraged private equity transactions, where the buyer is stacking debt on top of debt, the compression runs steeper still. That's not a rounding error. The cost of capital changing underneath a business is the difference between it selling at 6x and the same business, same cash flow, same customer base, selling at a noticeably lower multiple.
Q1 2026 data on Main Street businesses backs this up at ground level. Median sale price held flat at $350,000, and average cash flow multiples sat at 2.7x SDE. Demand for more heavily leveraged deals softened, even as competition for genuinely clean businesses, the ones with tight books and no owner-dependency issues, stayed intense. Move up to the middle market, and GF Data's numbers show average valuations falling to 7.0x trailing EBITDA in Q2 2026, down from 7.3x in Q1. Industry consensus for PE-sponsored middle-market deals still clusters around 7.2x to 7.5x, a range that's held roughly stable since mid-2024, but stable doesn't mean untouched. It means the compression is happening at the edges rather than across the board.
SBA-financed buyers typically pay 3 to 5 times EBITDA, while PE buyers pay 5 to 9 times, a gap that trips up sellers who benchmark against the wrong comp. That's not simply a difference in buyer sophistication or risk appetite. It's a difference in financing structure, full stop. The lender sets the ceiling for one buyer type, and a completely different capital source sets it for the other. A business priced to match a PE auction multiple cannot automatically clear at that number when the buyer at the table is financing through SBA 7(a). The bank doesn't care what the comp sheet says. It cares what the DSCR math says.
Where private credit fits, and where it leaves a gap at the sub-$50M level
Intralinks data put private credit at a market of nearly $1.3 trillion in the US, with more than $400 billion sitting undeployed. It has become the default source of debt capital for transactions below the billion-dollar threshold, filling space that syndicated bank lending used to occupy before the aftermath of the financial crisis reshaped how banks think about leveraged lending.
Pricing across the private credit landscape breaks into rough tiers. Lower middle market direct loans price at SOFR plus 500 to 650 basis points. Upper-middle-market direct loans run SOFR plus 400 to 500 basis points. Broadly syndicated leveraged loans, for comparable credit quality, price tighter still, at SOFR plus 300 to 400 basis points.
But here's the structural gap that matters most to a seller running a modest EBITDA business, or even less. The largest private credit platforms concentrate their check sizes at the upper end of the lower middle market and above. That leaves the middle stretch of the lower middle market EBITDA segment to a smaller set of relationship-driven lenders who have less capital to deploy and price accordingly higher for the risk. What's changed on the supply side is that Crescent Capital raised $10.8 billion in June 2026 for its largest direct lending vehicle aimed at the lower middle market, a real signal that institutional capital is starting to notice this gap. Still, capital concentration skews upmarket, and one large fundraise doesn't undo years of that pattern overnight.
Spreads in direct lending have widened since late 2025, and lenders are reasserting stronger covenant protections after a stretch where too much fundraised capital chased too few deals and pushed terms in the borrower's favor. Private credit default rates have risen sharply from the low levels seen in 2022, and that reversal tracks with rising default risk. Lender selectivity this year is a rational response to a default rate that more than tripled in four years. It's a rational response to a default rate that more than tripled in four years.
What does that mean sitting across the table from a seller? Private credit can absolutely close deals that traditional banks won't touch. But it arrives with higher rates, tighter covenants, and a shorter list of lenders willing to write the check, and reaching it requires a buyer who already knows how to structure around those constraints.
The three structural tools buyers use to close deals when debt capacity is constrained
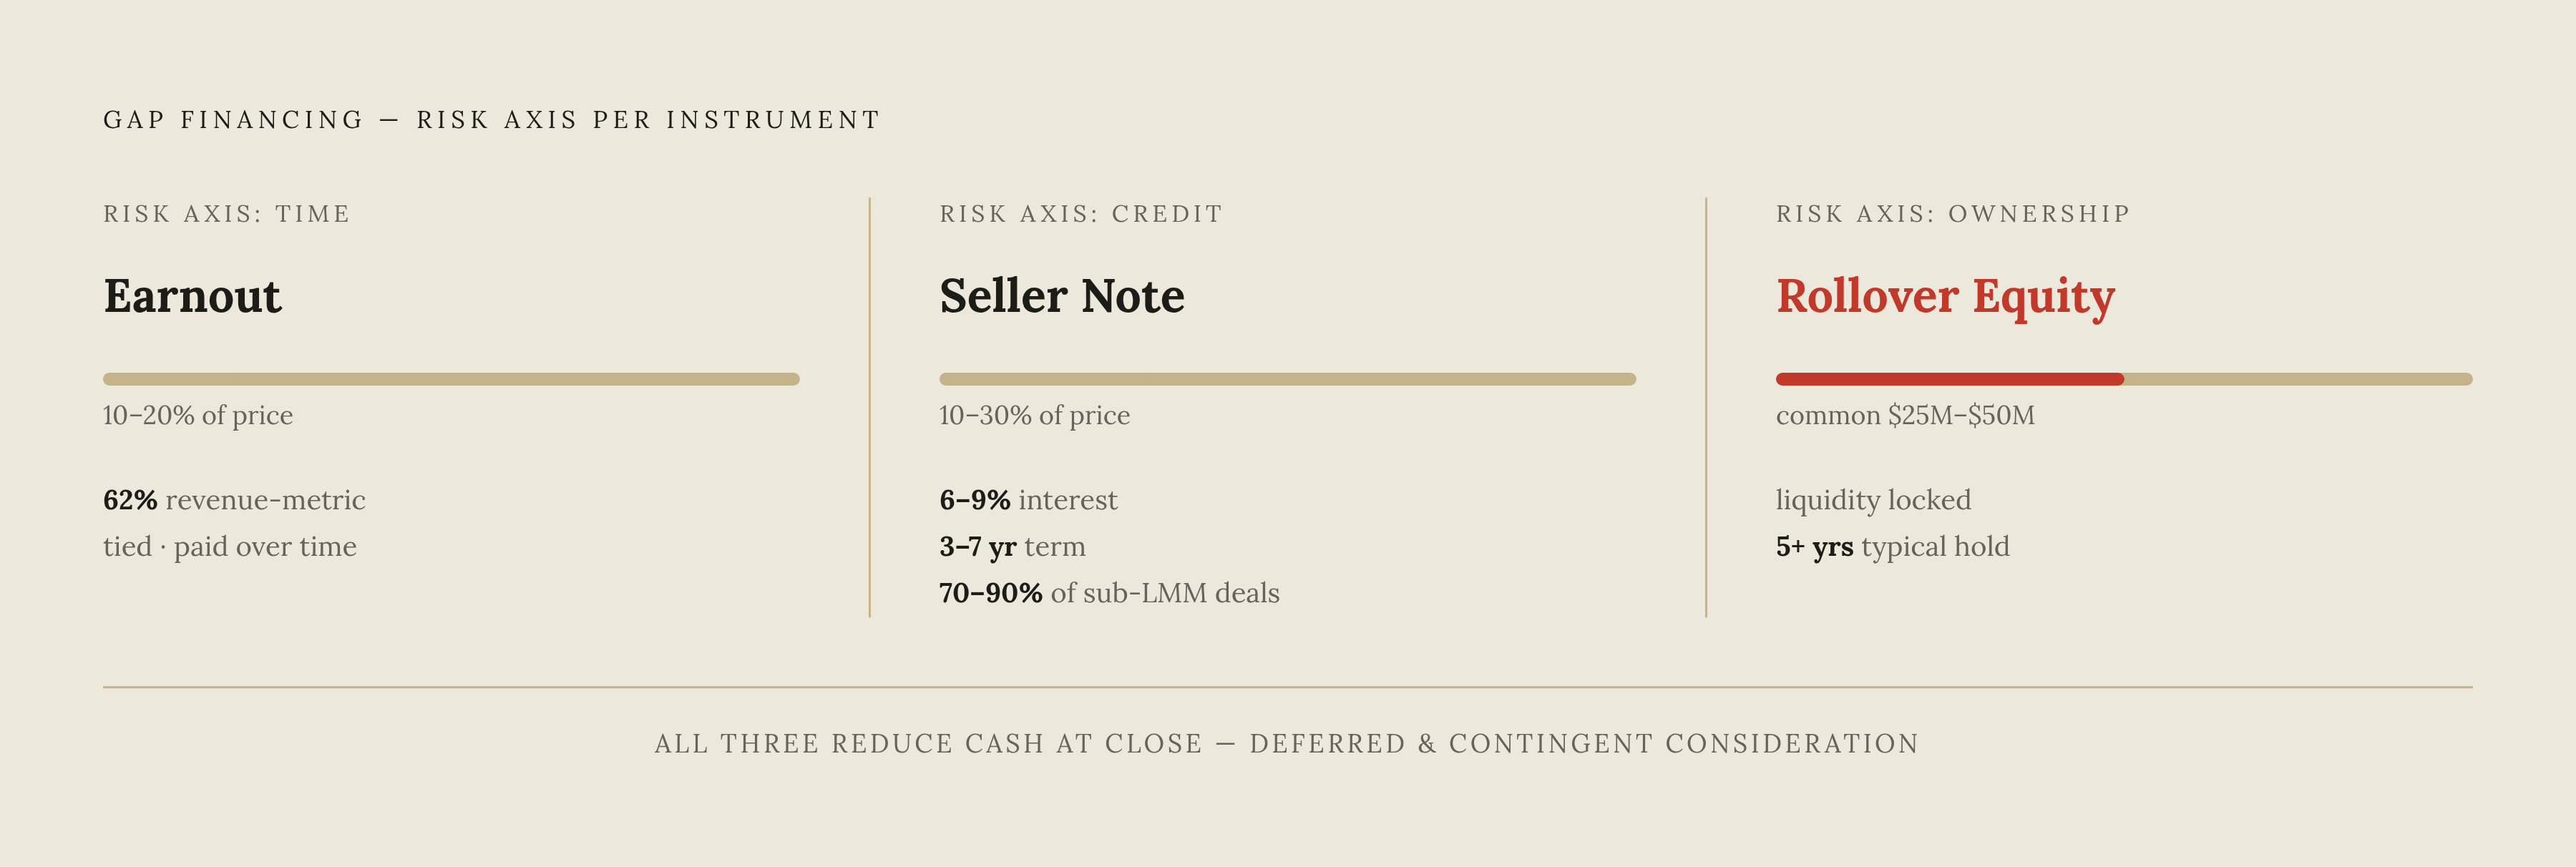
When the debt side of the stack can only support so much, the deal doesn't die. It restructures. Three instruments do most of the work absorbing the gap between what a lender will finance and what a seller wants to see at the closing table: earnouts, seller notes, and rollover equity. Each one shifts risk from buyer to seller along a different axis, and understanding which axis matters before signing anything.
Earnouts, from exception to standard practice
Buyers have grown reluctant to pay full price upfront for cash flow projections that haven't been proven out yet, and in a market where debt service, refinancing risk, and working capital needs all weigh heavier than they did five years ago, pushing part of the price into an earnout reduces the buyer's overpayment risk directly. Deallink's analysis flags this as one of the clearest structural shifts of the year. PE sponsors financing with more expensive senior leverage have particular reason to push headline price into contingent payments, since it keeps total leverage on the deal manageable at close.
The typical sizing is 10% to 20% of purchase price structured as contingent consideration rather than a straight balance-sheet liability. SRS Acquiom data from 2024 shows revenue-based metrics appear in roughly 62% of earnouts, metrics tied to a company's earnings base in roughly 22%, and hybrid or other structures make up the remainder. What's changed by 2026 is the drafting itself: buyers are writing tighter, more technical language focused on EBITDA quality, customer concentration, recurring revenue percentage, and margin sustainability, rather than broad top-line revenue targets that a seller with no operating control could easily miss or exceed for reasons that have nothing to do with actual performance.
That last point is where sellers need to slow down. If the earnout metric can be moved by decisions the buyer makes after closing (how much gets spent on sales and marketing, how integration gets sequenced, which product lines get resourced) then the seller is exposed to a number they no longer control. Negotiating protections around operating budget, decision rights during the earnout period, and integration pace is essential. It's the difference between an earnout that pays out and one that quietly doesn't.
Seller notes, from secondary tool to deal-closer
Seller financing shows up in an estimated 70% to 90% of acquisitions under the low end of the lower middle market, and in 30% to 50% of lower middle market deals in the tier above that. Typical terms run 10% to 30% of purchase price, amortized over 3 to 7 years (sometimes structured with a balloon payment), carrying interest of 6% to 9%.
That pricing, 5% to 8% in practice, actually sits below what senior debt costs right now, which is part of why it's become more central to closing deals rather than less. But a seller note rarely covers the whole purchase price on its own. It works best woven into a structured stack alongside SBA financing, and the SBA explicitly permits a seller note on standby, up to 5% of purchase price, to count toward the buyer's 10% equity requirement. That single provision has quietly become one of the more important structuring tools in deals at the low end of the lower middle market this year.
What sellers give up by accepting a note isn't small. Instead of a clean exit at closing, the seller stays economically tied to whether the buyer can actually run the business well enough to make the payments. Repayment priority relative to the senior lender, what collateral secures the note, what covenants apply, and what triggers a default all need real negotiation, not boilerplate. Deallink's reporting flags this as one of the more underappreciated risk transfers in the current market: the seller isn't just financing a sale, they're underwriting the buyer's operating competence for years after handing over the keys.
Rollover equity, increasingly common at the $25M to $50M mark
In the upper end of this range, sellers are increasingly asked to retain a stake in the business rather than cash out entirely. Rollover equity reduces the cash-at-close burden on a buyer working with constrained debt capacity, and it gives the seller a shot at a second payout if the PE buyer grows the business toward a future exit.
It also comes loaded with its own negotiation complexity: how the rolled equity gets valued, what governance rights come attached to it, how drag-along and tag-along provisions work if the PE sponsor sells before the seller wants to, and what the actual liquidity timeline looks like. A seller holding equity that can't be sold for five years has a very different risk profile than one holding cash, even if the two numbers look similar on a spreadsheet.
Three tools, three different kinds of exposure. An earnout shifts risk across time. A seller note shifts risk across credit, tying repayment to the buyer's ongoing solvency. Rollover equity shifts risk into ownership itself, tying the seller's outcome to a business they no longer control day to day. None of these are bad terms inherently. But accepting one without understanding which risk it transfers is how a seller ends up disappointed two years after a deal that looked great on the signing day.
Why headline multiples can be misleading when structure has changed underneath them
Here's the puzzle a lot of sellers run into when they start pulling comps in 2026. GF Data shows middle-market multiples holding in a fairly narrow 7.0x to 7.5x band. BizBuySell shows Main Street prices flat at a $350,000 median. Neither number looks alarming on its face. So why does the on-the-ground experience of selling feel so different from what it felt like even three years ago?
The headline multiple only captures one number: price divided by earnings. It says nothing about how much of that price is cash in the seller's account at closing versus how much is deferred into an earnout, a note, or rolled equity. A stable 7x multiple in 2021 might have meant 90% cash at close. That same 7x multiple in 2026 might mean a smaller majority in cash at close, with the rest spread across a seller note and an earnout tied to metrics the seller has to keep monitoring for two or three years. The number on the letter of intent didn't move. The actual deal that produced this outcome moved plenty.
Data on lower middle market dealmaking through the first half of 2026 backs this up from another angle: valuation expectations were flagged as the leading cause of failed deals by 57% of dealmakers surveyed. Buyer competition for genuinely high-quality assets keeps pushing headline asking prices up, even as financing conditions and softer business performance limit what a buyer can actually pay in cash once the lender's underwriting takes over. That's a real tension, not a contradiction: buyers want the asset badly enough to bid the headline number up, but the debt behind that bid can't stretch as far as it used to.
Lender behavior confirms the selectivity. Windes and GF Data reporting shows total debt utilization for platform buyouts falling to a level well under 3 times EBITDA in Q2 2026, with senior debt specifically down to 2.0 times EBITDA. That's a lender base willing to fund attractive deals but unwilling to stretch leverage broadly across the market the way it might have a few years back. Deal activity itself is still healthy by volume, with LMM deal counts up 4.79% year over year even as global deal counts fell elsewhere, and GF Data's middle-market contributors reporting 85 completed transactions in Q2 2026, putting the full year on pace roughly 10% above 2025. GF Data's middle-market contributors reported 85 completed transactions in Q2 2026, putting the full year on pace roughly 10% above 2025. But it's concentrating into quality tiers, and the businesses that don't clear that bar are the ones absorbing the structural change most heavily, even while their comp sheet still shows a respectable multiple.
A seller looking at a comp of 6x EBITDA needs to ask what's actually behind it before treating it as a benchmark. How much was cash at close? How much was an earnout tied to revenue the seller no longer controls? How much was a note carrying 7% interest for six years? Those three questions determine how much the deal is actually worth, because the multiple is the headline, and the structure is the deal.
What sellers in the $500K–$50M revenue range should expect at the table in 2026
The market hasn't closed. Deal volume is up year over year, and buyers with real capital, whether individuals backed by a government-guaranteed loan program, regional PE platforms, or larger strategic acquirers, are actively transacting. But the terms on offer in 2026 look structurally different from what a seller might have expected walking into a negotiation in 2021, and the gap between expectation and reality is where deals stall or, worse, where sellers accept terms they don't fully understand.
The buyer's lender sets the price ceiling, not the buyer's enthusiasm for the business. DSCR math doesn't bend for a seller's asking price, and no amount of rapport at the negotiating table changes what a bank's underwriting model produces. Some form of seller participation beyond the closing date is close to standard now: a note, an earnout, or often both together. A fully cash-at-close deal, once the norm for a well-run business with clean financials, has become the exception rather than the rule for buyers financing with any real leverage.
Earnout metrics arriving at the table will be specific and will get contested, and a seller who hasn't thought through which levers they can still pull post-closing (customer relationships, pricing, service quality) versus which ones the buyer now controls (budget, staffing, integration timeline) is negotiating from a weaker position than they realize. Qualification requirements for SBA-financed buyers aren't a formality either. A buyer who can't clear the 680 FICO threshold, come up with 10% cash equity, or show two years of relevant management experience simply cannot close, no matter how much they want the business or how well the two sides get along personally.
Perhaps most useful for a seller trying to calibrate expectations: the buyer pool itself is tiered by capital access, and that tiering determines what's realistic. A PE-backed platform or a strategic acquirer with balance sheet strength can pay a higher multiple and offer more flexible structure than an individual buyer financing through SBA 7(a), because the two are drawing from entirely different pools of capital with entirely different cost structures behind them. Knowing which buyer type actually fits a given business, by size, by cash flow profile, by industry, is the difference between negotiating from an informed position and hoping the first offer that arrives is a fair one. In a financing environment this segmented, hope isn't a strategy. Understanding the stack is.