Lower Middle Market Deal Volume in Canada 2024
Eight mega-deals drove Canada's 2024 PE record while smaller transactions stalled.
Canadian M&A didn't move much by deal count in 2024. It moved a lot by dollar value. That gap between a flat number of transactions and a sharp jump in total deal value is the story this piece works through, sector by sector and number by number, because it tells founders something specific about who's actually buying and when to sell.
The 2024 Canadian M&A headline: flat deal count, recovering deal value
Start with the top-line number from Crosbie & Company: total Canadian M&A deal value hit CAD $255 billion in 2024, up roughly 20% from CAD $212 billion in 2023. Transaction count, meanwhile, landed just shy of 2,600 deals, essentially flat for the second year running. That's the whole tension in one sentence: value up sharply, volume barely moving.
What does that mean in practice? It means the average deal got bigger, or a small number of very large deals pulled the total upward while the broader market of ordinary-sized transactions stayed where it was. Crosbie's quarterly data backs this up: four straight quarters of announced-deal growth through 2024, though sentiment faced headwinds late in the year.
A mid-year check from PwC and Capital IQ adds texture here. Between January and May 2024, there were 952 deals worth a combined CAD $72 billion, a pace roughly consistent with the full-year shape once you annualize it. But completed-deal data from Cassels and Bloomberg for the first half of 2024 tells a different story: completed deals were down year-over-year, both by value and by count. Announced deals and completed deals aren't the same thing, and the gap between them affects how the market's health should be read: a deal counted as "announced" can still fail to close. A deal gets announced when terms are signed; it gets completed after financing closes, regulatory approval clears, and due diligence doesn't blow anything up. Cassels' H1 figures also showed Canadian mid-market M&A specifically down 18% by value and 14% by number of deals year-over-year. So even as the full-year total climbed, the middle of the market was still digging out of a hole at the halfway mark.
Why open with the CAD $255 billion figure and then immediately complicate it? Because a founder who only sees the headline recovery number might assume 2024 was a strong year across the board. It wasn't, evenly. It was a strong year for a certain kind of deal.
Where the lower middle market sat in the deal count: the 84% figure and what it means
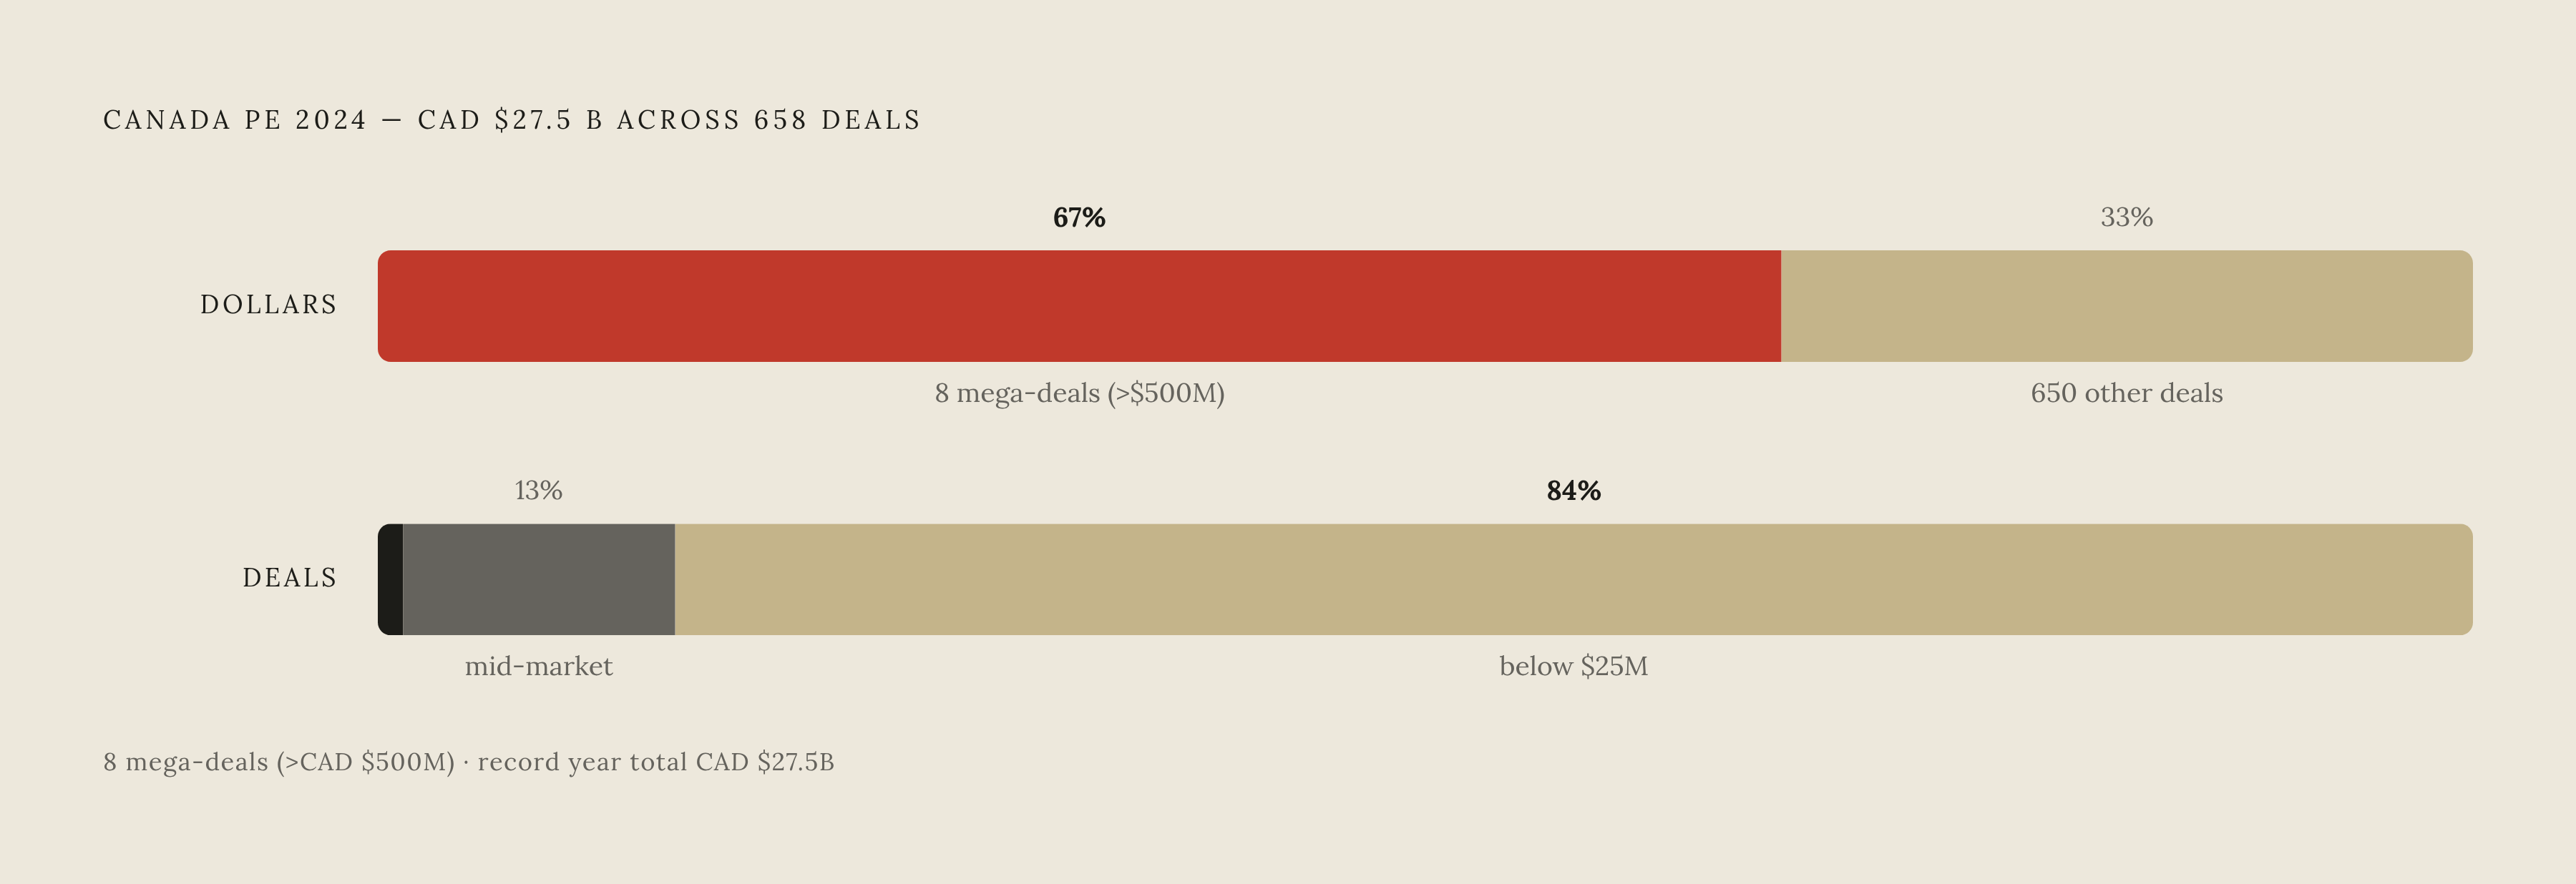
The CVCA's year-end report found that 84% of all private equity deals with disclosed values in Canada in 2024 came in below CAD $25 million. That's not a one-off. It matched the 2023 pattern, it showed up again in CVCA's Q1 2024 data (84% below $25 million, another 8% in the $25 million to $100 million band), and it held again in CVCA's H1 2025 report at 86%. This is the structure of the Canadian PE market. It's the structure of the Canadian PE market.
Flip the number around and something interesting happens. The same CVCA data shows that mid-market deals under CAD $250 million accounted for only about 7% of total PE dollars invested in 2024, despite making up the overwhelming majority of deal count. Frequency and value point in opposite directions. Small deals happen constantly; large deals move the money.
For a founder running a business in the lower middle market, what does this actually tell you? It tells you the segment isn't starved for activity. Deals are getting done, constantly, at this size. A kind of missing middle persists where sellers who expect to land in the CAD $25 million to $100 million range often find fewer buyers waiting than they assumed. That band, right where a lot of growth-stage companies expect to sell, saw softer activity even while the sub-$25 million tier kept humming.
Private equity's 2024 surge bypassed the lower middle market
Private equity had a record year in Canada in 2024, at least by the topline. CVCA reported CAD $27.5 billion invested across 658 deals, a number that surpassed every annual total over the prior six years. That sounds like unambiguous good news for anyone hoping to sell a business to a PE buyer.
Look closer and the picture narrows fast. Eight mega-deals, defined by CVCA as transactions over CAD $500 million, accounted for 67% of all PE dollars invested that year. Two-thirds of the record-setting total came from eight transactions. Fasken's summary of CVCA data shows Q4 2024 alone delivered 56% of the year's total capital invested (CAD $15.4 billion) across just 26% of the year's deals (174 of them), an exceptionally large dollar amount for a single Canadian PE quarter. The privatizations of Nuvei and Sleep Country drove much of that quarter's number.
Average deal size jumped 169% year-over-year to CAD $41.8 million, sitting 70% above the five-year average. That statistic looks dramatic until you remember what a median is. The average gets dragged upward by mega-deals in the same way a handful of nine-figure salaries drag up the average income at a mid-sized company; the distribution of deals in Canada remained heavily concentrated below CAD $25 million, consistent with what the 84% figure describes. McCarthy Tétrault's H1 2024 analysis makes the same point from a different angle: aggregate PE deal value rose 258% year-over-year in H1, while deal count rose only 2%. That is not a broadening market. That is concentration.
Exits told a similarly narrow story. Eighty-six PE exits happened in 2024, with M&A transactions accounting for all of them and zero PE-backed IPOs recorded for the year. Zero PE-backed IPOs were recorded for the year. For lower middle market founders and their potential PE partners, that closes off one exit path entirely and leaves strategic sale and secondary buyout as the realistic routes out. A record PE year, in other words, doesn't mean the taps opened for every business under a certain revenue threshold well short of the largest deals. It means a handful of very large transactions inflated the headline while the smaller end of the market kept moving at its usual pace, which, given the 84% figure, was never especially slow to begin with.
What drove the recovery: rate cuts, valuation gaps narrowing, and the dry powder dynamic
Three forces explain most of the 2024 recovery, and they interact in ways that should be pulled apart individually rather than lumped together as "the market got better.""
The first is interest rates. Fasken's December 2023 forecast, written before any 2024 deals had closed, anticipated the Bank of Canada would start cutting rates as early as Q3 2024 and called that a likely stimulant for M&A by loosening credit conditions that had been unusually tight. That call turned out directionally right; the Bank of Canada did cut through 2024, and cheaper credit tends to make buyers more willing to lever up for acquisitions.
The second is the valuation gap between buyers and sellers, which had kept a lot of would-be sellers on the sidelines through 2022 and 2023. Industry observers noted that gap softening, not closing, but narrowing enough to bring more sellers into active conversations. One might ask why a gap that narrows matters more than a gap that closes. It matters because narrowing changes seller psychology well before it changes deal terms; sellers who'd been waiting for "fair value" start testing the market once the gap looks bridgeable rather than fixed. But the same SRS Acquiom data shows the underlying caution hasn't disappeared: more than a third of buyers in the sub-CAD $25 million tier still insisted on earnouts in 2024, and earnout percentages on those deals ran roughly twice as large, proportionally, as those on deals double the size. Buyers are still hedging. They're just willing to transact while hedging.
The third force is dry powder, the term for capital that PE funds raised but haven't yet deployed. Funds that raised money during the 2021 peak have been sitting on uninvested capital longer than usual, and MNP's Q2 2026 update describes ongoing pressure on PE firms to deploy "substantial amounts of uninvested capital" as a live dynamic well into 2026. If the pressure to deploy hadn't resolved by mid-2026, it was almost certainly building through 2024, pushing PE buyers toward deals they might otherwise have passed on. Layer in the reality that private credit growth only partially filled the gap left by tighter bank lending, and you get sponsors putting in more equity per deal than they'd prefer, which compresses their eventual returns and makes them choosier about which deals get done.
Put the three together and the 2024 recovery reads less like exuberance and more like a slow unlock: rate relief brought sellers forward, dry powder pressure kept buyers motivated, and a narrowing (not vanished) valuation gap let more of those two groups actually agree on price.
Which sectors attracted lower middle market activity in 2024
Technology led on dollars. Industry research indicates the ICT sector captured a leading share of PE dollars invested through much of 2024. On the broader M&A side, technology and software services consistently ranked among the most active sectors by deal count through the year.
Industrials told a different story, one that maps more directly onto the lower middle market's usual shape. It was the most active PE sector by deal count through Q3 2024, with 112 deals, even though total investment value in the sector fell short of prior years. High frequency, modest average size, that's the signature of LMM activity, and MNP's Q2 2024 data confirms the pattern at the broader market level too: industrials accounted for 21.8% of all mid-market transaction count that quarter, ranking among the top sectors by deal volume.
Healthcare services gave founders a useful, if sobering, data point on pricing. Healthcare services valuations varied meaningfully by deal size through 2024, and that divergence is exactly the kind of dynamic a founder in that sector needs to understand before walking into a valuation conversation with expectations set by headline multiples that don't apply to their size tier.
Quebec stood out geographically. Through 2024, the province demonstrated notable activity, supported by a strong local institutional investor base active in the province. Founders based in Quebec are operating in a market with a meaningfully deeper local buyer pool than most of the rest of the country. Fasken's December 2023 forecast also flagged cleantech, infrastructure, agribusiness, and critical minerals as sectors to watch, along with an emerging interest in housing development supply chains, worth noting as forward indicators rather than confirmed 2024 outcomes.
What 76% of Canadian owners planning to exit within ten years means for deal supply and timing
Step back from 2024's transaction data for a moment and look at the supply side of the market instead of the demand side. A small business association surveyed business owners in 2022, publishing results in 2023, and found that 76% of them planned to exit their business within ten years. That is a staggering share of the country's privately held businesses, all pointed toward the exit door within a single decade.
What happens if a large share of that 76% tries to sell in the same narrow window? Basic supply and demand logic says seller leverage compresses. More businesses for sale competing for a buyer pool that doesn't expand at the same rate means downward pressure on multiples and longer time-to-close, even for good businesses. That raises an important question for anyone sitting inside that 76%: has the wave already hit, or is it still building?
The 84% figure from CVCA describes current PE activity: deals happening right now, mostly under CAD $25 million. The CFIB's 76% describes a future supply pipeline that, by definition, hasn't fully entered the market yet. Those two numbers sit in tension, and that tension is exactly what defines the timing decision for an individual founder. Move early, and there's less competition for buyer attention. Wait, and the field gets more crowded right as credit conditions might tighten again if rates reverse.
The zero-IPO PE exit environment from 2024 sharpens this further. With no public listings among that year's 86 PE exits, strategic sale and secondary buyout aren't just the preferred path for lower middle market founders. They're close to the only realistic ones. That reframes succession planning for a lot of business owners: many lack a clear internal successor, a family member or management team ready to take over, which means the business is heading toward some kind of ownership transition regardless of whether the founder actively plans for one. The only variable left is whether that transition happens on the founder's terms or gets forced by circumstance.
How founders should read 2024 data when assessing their own exit timing
Lining the numbers up produces a consistent picture. Deal count is stable and structurally concentrated at the sub-CAD $25 million level. Value has recovered, largely on the back of mega-deals most lower middle market sellers will never touch. Rate conditions improved through the year. PE dry powder keeps buyers under pressure to deploy capital. None of that, on its own, guarantees a good outcome for any single seller.
Why not? Because the valuation gap narrowed, it didn't close, and SRS Acquiom's data on earnouts and escrow terms in 2024 shows buyers at the smaller end of the market still building in protection against uncertainty. A seller who walks into that environment with clean financials, a clear growth narrative, and a defined buyer thesis has real leverage. A seller who walks in reactively, financials scattered across three different bookkeeping systems, no clear answer for why a buyer should want this business specifically, does not.
There's also a plain asymmetry: the 84% concentration of deals below CAD $25 million means the buyers active at that size are repeat players. The 84% concentration of deals below CAD $25 million means the buyers active at that size are repeat players. They've done this before, often many times. A founder selling a business for the first time is negotiating against someone who negotiates for a living, and that gap in experience raises the stakes in every term of a deal, from working capital adjustments to earnout triggers.
Timing cuts in the founder's favor for now, but not indefinitely. The CFIB's succession wave hasn't peaked yet, based on the ten-year horizon most of those owners cited, which means founders who move in the next two or three years are likely competing against less supply-side pressure than those who wait until that wave crests. Rate conditions add a second, more immediate consideration: MNP's Q2 2026 update shows the Bank of Canada holding its policy rate at 2.25% amid ongoing trade and inflation uncertainty, which means the favorable credit window that opened through 2024's cuts remains open for now, but it isn't guaranteed to hold indefinitely.
So the honest framing for a founder doing somewhere between CAD $500,000 and a revenue level well beyond most lower middle market businesses isn't?" There clearly is one, with 658 PE deals closing in Canada in 2024 and dry powder pressure still building toward deployment. The real question is narrower and harder to answer from a spreadsheet alone: is the business positioned to attract the right buyers, at the right moment, with the kind of preparation that turns a repeat-player buyer's usual advantage into a fair negotiation instead of a mismatch? That's where pairing broad, data-driven buyer identification with hands-on deal advisory earns its place, not by finding a buyer who's merely plausible, but by finding the one who's actually the right fit, and running a process with the same rigor and structure that a much larger transaction would command.
Sources
- Fasken 2024 M&A Forecast | Knowledge | Fasken
- Canadian LMM Private Equity Opportunity | 2026 Data & Statistics
- Lower Middle Market M&A Deals – Everything You Need to Know
- Canada's Middle Market M&A Update - Q2 2024
- 2024 Mid-Year Canadian M&A Update: Resilient Deal Strategies for Dynamic Markets
- fasken.com
- State of the Market
- mccarthy.ca