EBITDA Multiple Compression in Small Business Sales
Well-prepared businesses command multiples two turns higher than neglected ones in the same sector.

EBITDA multiple compression in small business sales is not a rumor traded at broker conferences. It shows up in the data: average SMB acquisition multiples fell from a peak of 6.7x in 2017 to 4.3x in 2025, with a brief bounce to 5.9x in 2021 before resuming the slide. But that headline number hides something owners need to understand before they list a business, because the compression is not evenly distributed. A well-prepared company and a neglected one, sitting in the same sector, can transact at multiples that differ by more than two turns of EBITDA. The rest of this piece works through why, and what an owner can actually do about it.
Even at the aggregate level, the trend has not stabilized. BVR DealStats put the all-industry median at 3.5x in the fourth quarter of 2025, down from 3.7x the quarter before and well off the 4.8x high recorded in the second quarter of 2024. Main Street deals, priced differently and covered in the next section, average around 2.5x across more than 9,500 transactions tracked in 2025, with BizBuySell's live Q2 2026 figure at 2.7x. For owners who assumed their business would fetch "four or five times earnings" because that's the number that circulates at industry meetups, the floor is lower than expected, and the ceiling depends on factors that have nothing to do with luck.
How the earnings basis (SDE vs. EBITDA) changes what a multiple means
Before comparing any two multiples, ask what they were multiplied against. That sounds obvious, but it is the single most common error owners make when benchmarking their business against "comparable" sales.
The market splits at a threshold level of enterprise value that separates two distinct pricing approaches. Below that line, deals get priced on SDE, seller's discretionary earnings, which adds back the owner's salary and personal perks run through the business. Above that line, buyers price on EBITDA, with a market-rate management salary baked into the cost structure instead of added back. IBBA's Market Pulse data for the third quarter of 2025 shows the progression clearly: 2.0x SDE for businesses under $500,000, then a progression through the middle bands before reaching 5.3x EBITDA for $5 million to $50 million.
The transition is not a smooth glide; it is a change in what's being measured. It is a change in what's being measured. An owner who hears that a peer's business "sold at 4x" and assumes the same multiple applies to their own EBITDA figure, when the peer's deal was actually priced on SDE, can end up a full turn off the market in either direction. That is not a rounding error. On a business earning a given amount, one turn of EBITDA translates directly into that same amount in proceeds, which is not a number anyone should get wrong by accident.
Among M&A advisors, recast, or adjusted, EBITDA is widely regarded as the most commonly used valuation basis. Recasting means normalizing the earnings figure before any multiple touches it: add back owner compensation above market rate, strip out one-time legal costs, remove non-recurring items like a single large customer refund. If this step is skipped, the multiple, however accurate, gets applied to the wrong number. Two owners trading war stories about "my business sold at 4x" may be describing transactions that share nothing but a digit.
Size is the biggest driver of where within the compressed range a business lands
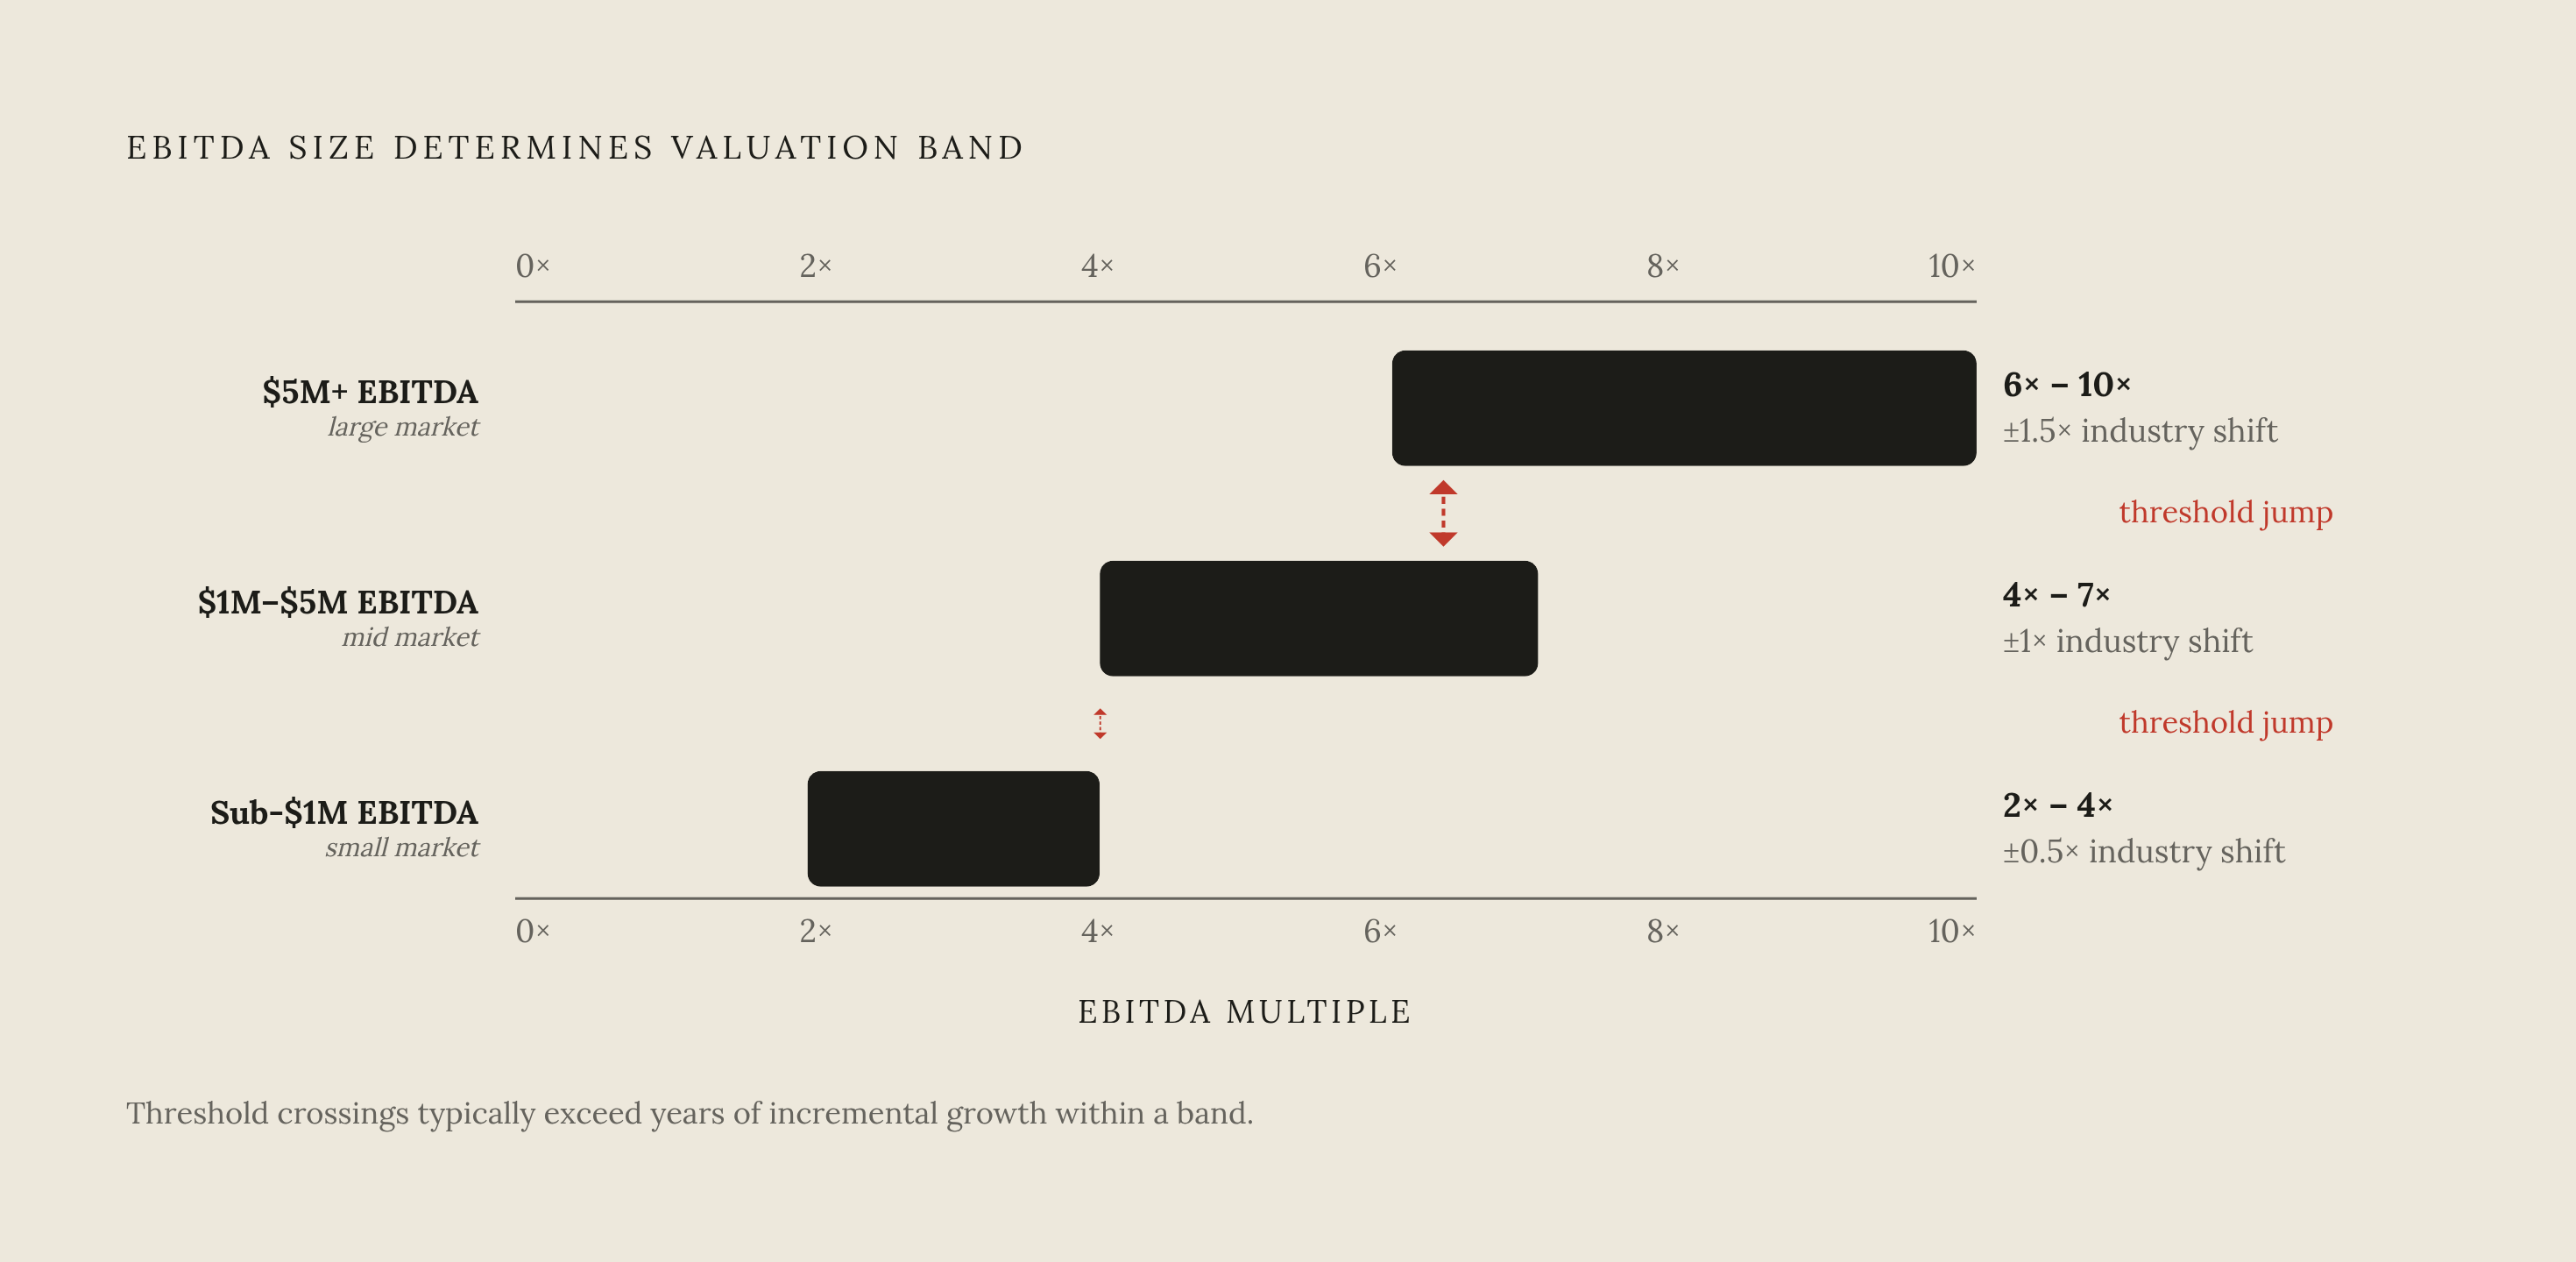
Sector gets discussed constantly at trade shows and in broker pitches. Size gets discussed less, and it should probably get discussed more, because it does more of the work.
IBBA's Q3 2025 data again: median multiples ran from 2.0x for the smallest businesses up to 5.3x for lower-middle-market companies. For 2026, the broad size bands look like this: sub-$1 million EBITDA trades at 2x to 4x, the $1 million to $5 million range trades at 4x to 7x, and $5 million-plus clears 6x to 10x. Industry shifts the multiple within those bands by roughly 0.5x to 1.5x. Size sets the band itself.
Why does this happen structurally, rather than just as a market quirk? Research from Duff & Phelps (Kroll) and related academic work shows that buyers require a higher rate of return from companies below a certain, much larger, threshold of enterprise value. A higher required return, mechanically, means a lower price paid for the same dollar of earnings. Layer on top of that the discount for lack of marketability, which for private companies typically runs 15% to 35% depending on size and profitability. Selling a private business usually takes six to twelve months, involves a search for a qualified buyer, and requires diligence and negotiation that a public-market seller never faces. All of that friction gets priced in.
Below $2 million in EBITDA, the buyer pool has actually gotten thinner. Recent rule changes affecting government-backed acquisition lending have tightened eligibility for some borrowers. Fewer qualified buyers means less competitive tension in a sale process, and less competitive tension compresses the multiple directly, independent of anything about the business itself.
One might argue this means an owner should chase scale for its own sake. But the more precise lesson is narrower: growing EBITDA enough to cross a size threshold, say from one level up to a level roughly a fifth higher, can produce a jump in valuation that is not linear. It is discontinuous. The last small increment of EBITDA growth might be worth more per dollar than everything gained before it combined, because it moves the business into a different pricing band.
Interest rates and multiple compression, and what the partial easing means now
Rates do not touch a business's revenue or its customer list. They touch what a buyer can afford to pay for it, and that distinction matters.
Mercer Capital's analysis found that a 250-basis-point increase in the federal funds rate produces roughly a 25% decrease in EBITDA multiples for debt-free businesses. For leveraged private equity transactions, the same rate move produces an even sharper compression in multiples. The mechanism is not complicated: when debt is cheap, a buyer can borrow more against the same earnings stream and bid higher; when debt is expensive, the amount of debt service the business can support shrinks, and so does the bid.
The federal funds rate held at 5.33% for thirteen months before the Fed cut three times in late 2025, landing the effective rate around 3.5% to 3.75% through the first half of 2026. That partial easing is part of why multiples appear to have stabilized rather than continuing their decline. But how does this affect the buyer actually sitting across the table from an owner? SBA 7(a) acquisition loans in the second quarter of 2026 averaged roughly 10.75% all-in, prime plus 2.5 to 2.75 points, with ten-year amortization on the goodwill portion of the deal. That is the real financing cost most Main Street and lower-middle-market buyers are working against, regardless of what the Fed's headline rate suggests.
Praxis Rock's math on the private equity side makes the shift concrete. A deal that in 2015 needed roughly 5% annual EBITDA growth to hit a 2.5x return now needs 10% to 12% annual growth to hit the same target, because entry multiples for larger buyouts are an elevated 11.8x, debt costs 8% to 9% instead of 4% to 5%, and leverage makes up only 37% of the entry price rather than the higher share buyers used in the prior cycle. Rates easing put a floor under valuations. It did not restore 2021-era math. Buyers, at every size tier, now need businesses that can grow, not just hold steady.
Where sector matters, and where other factors override it
Sector matters, just less than most owners assume, and unevenly across industries.
Consumer and retail saw the sharpest pullback, falling from a 10x to 12x range in 2022 down to 7x to 9x by 2025. GF Data reported healthcare multiples dropping from 7.0x EBITDA in 2024 to 5.8x in 2025, pressure that traces back to regulatory tightening and struggles among private-equity-backed platforms in the space. Not every sector moved the same direction, though. Insurance agency multiples expanded 29% since 2020, climbing from 9.4x to 12.1x EBITDA. Sica Fletcher reported an average of 11.8x EBITDA for agency transactions above $1 million in EBITDA during the first half of 2025, with more than fifty active consolidators competing for deals and private equity accounting for roughly 72% of all agency transactions. That level of buyer competition produced the 72% private equity share of agency transactions and the fifty-plus active consolidators described above.
Down at the Main Street level, priced on SDE rather than EBITDA, the sector spread in 2026 looks like this: HVAC businesses trade at 3x to 5x with a strong upward trend driven by private equity roll-up activity, restaurants sit in a much rougher 1.5x to 3x band averaging around 2.15x and trending flat to down, car washes are at the high end of the SDE table, and ecommerce businesses are flat to down, according to BizBuySell transaction data compiled by Jenesh Napit for 2026.
Manufacturing tells an even sharper story about how much sub-sector detail matters. Commodity contract manufacturing trades at 4x to 6x EBITDA. Specialty manufacturing, the kind with proprietary products, long-term contracts, or a regulatory moat protecting it, trades at 7x to 10x. MergeX's dataset shows that aerospace, defense, and medical device manufacturers holding qualified supplier positions can clear 10x to 12x. Three "manufacturers," three entirely different valuation conversations.
The market is effectively bifurcated: A-tier assets, meaning strong growth, recurring revenue, and professional management, draw deep buyer competition and reach the top of whatever range applies. B-tier assets, flat growth and heavily owner-dependent, face compressed valuations and longer time-to-close regardless of which sector they sit in. That's the practical limit of sector analysis. Industry shifts the band by a meaningful but bounded amount. Company-specific factors, covered next, can move it by more than that. Sector is where the conversation starts, not where it ends.
The company-specific factors that determine where within the sector range a business trades
This is where the math gets personal: an owner's decisions over the prior few years determine specific dollar amounts in the final valuation.
Owner dependency is the largest single discount most businesses carry. A company where the owner works fifty-plus hours a week and personally holds the key customer relationships might clear only 3.5x to 4.0x in a sector that typically trades at 5.0x. On $2 million of EBITDA, that gap is worth $2 million to $3 million in proceeds, gone, because the business cannot run without the person selling it. Key-person dependency typically shaves 1.0x to 2.0x off the multiple and often forces structural changes into the deal itself: longer transition periods, earnouts tied to post-close performance, retention bonuses to keep key employees from walking, customer retention holdbacks, larger escrows. The total owner-dependency discount can range materially off an otherwise healthy valuation, depending on how deep the dependency runs. That is a wide range, and where a given business lands inside it depends entirely on how deep the dependency runs.
Customer concentration works the same way, just through a different mechanism. Businesses where no single customer exceeds roughly 10% of revenue, and where the top handful of accounts stay well under half of total revenue, trade at materially higher multiples than peers with a concentrated customer base. Transaction data consistently shows businesses with low customer concentration receiving offers meaningfully above peers whose top customers make up more than half of revenue. The exact spread varies by deal, but the direction is not ambiguous: buyers pay less for revenue they see as fragile.
Recurring revenue changes the risk calculus for a buyer in a way project-based revenue cannot. The premium recurring revenue commands is substantial in B2B SaaS and more modest in manufacturing, but it moves in the same direction everywhere, because it reduces the buyer's uncertainty about what happens to revenue the day after close. An HVAC business built around maintenance contracts is a fundamentally different asset than one built around one-off installation jobs, even if both call themselves "HVAC" and sit in the same SDE band discussed earlier.
Growth rate adds another layer on top of all of this. A business posting strong year-over-year EBITDA growth can command a multiple meaningfully above a flat or declining competitor in the same sector, because growth signals to a buyer that there is a market opportunity left to capture, not just a stable cash flow to inherit. Sofer Advisors also flags a handful of additional compression factors: margins running below industry peers, deferred capital expenditures or aging equipment nobody has replaced, pending litigation or regulatory exposure, and a declining revenue trend over the prior two years. Each of these is a specific, checkable item. None of them are mysteries.
The supply-side pressure building behind these compressed multiples
Everything above describes forces already in the market. What's coming is arguably larger.
Demographic trends point to a substantial wave of SMB ownership transitions in the coming decade, with a large share of those businesses representing meaningful aggregate enterprise value. More than half of businesses in one country. More than half of small-business owners are 55 or older, and only about half of them have any kind of succession plan in place, a generation of business owners approaching an exit with no defined path to one. That is not a small planning gap. That is a generation of business owners approaching an exit with no defined path to one.
Has the wave actually hit yet? The data says not fully. BizBuySell reported roughly 9,586 closed transactions in 2025, a 3% increase in total enterprise value year over year, which is growth, but not a flood. Transaction volume ticked up only slightly, suggesting the anticipated supply glut has not yet overwhelmed buyer demand. But the entry multiples, debt costs, and leverage share described above make the structural math unfavorable even when the surface looks calm. A large cohort of boomer-owned businesses is heading toward some kind of transition in the coming years, and the buyer pool has not grown to match. More sellers competing for a buyer base that isn't expanding proportionally is, mechanically, downward pressure on multiples over time.
The starkest number in this entire dataset might be this one: only 20% to 30% of businesses that go to market ever actually sell. The rest shut down or transfer informally, often at valuations far below what a prepared sale could have achieved. Extending that further, only 30% to 40% of boomer-owned businesses are expected to sell at all, with the remainder closing outright or transferring through informal, unstructured means. That is the outcome every section above is, implicitly, about avoiding.
As the supply of businesses coming to market grows, and the pool of qualified buyers does not grow at the same pace, the gap between owners who prepared and owners who didn't should widen, not narrow. It is where the math points, not a guarantee. It is where the math points.
What "preparing the business" means in practice, given where multiples compress
Every factor that compresses a multiple, covered across the sections above, is also a factor an owner can audit and, given enough runway, change. The entire argument of this piece is this: compression is real and it is not evenly distributed, and where a specific business lands within its range is not left to chance.
Start with the six factors laid out earlier: owner dependency, customer concentration, the mix of recurring versus project revenue, growth rate, margin profile relative to peers, and deferred capital expenditures. Each one maps to a specific, identifiable discount that a buyer's advisor will apply during diligence whether or not the seller has already accounted for it. Auditing these before going to market, rather than discovering them during a buyer's due diligence, means negotiating from a position of knowledge instead of a position of surprise.
Reducing owner dependency is probably the single highest-leverage move available, because the discount it drives, 1.0x to 2.0x on EBITDA, is large enough to be worth the multi-year effort of building it out. Moving from an owner working fifty-plus hours a week to a business with a documented management layer, written processes, and customer relationships that don't run exclusively through one person, can close a meaningful share of that gap. It won't happen in a quarter. Twelve to thirty-six months is the realistic window most owners are working with, so starting the audit early gives more time to close the gap than starting it thoroughly does.
Clean financials carry nearly as much weight as clean operations. Since Pepperdine's 2025 research found recast EBITDA to be the dominant valuation basis among M&A advisors, an owner who arrives with well-documented add-backs, clear support for each one, and no scrambling to reconstruct historical numbers reduces buyer skepticism before it starts. That reduction in friction produces a faster process and fewer renegotiated terms later in the deal.
Buyer pool depth deserves the same deliberate attention. A sale process that reaches only a handful of interested parties generates little competitive tension, and a lack of competitive tension is, on its own, a multiple-compressing force independent of how good the underlying business is. The insurance agency numbers cited earlier, more than fifty active consolidators bidding and multiples expanding 29% since 2020, are not an accident of a hot sector. They are what happens, structurally, when a business reaches a genuinely deep and competitive buyer pool. That is the target every owner preparing a sale should be building toward, sector notwithstanding.
Sources
- Valuation Multiples in 2026: What Drives Your Business's Price · Iconic
- Average EBITDA Multiples by Industry (2026 Data) | Praxis Rock
- 2026 Business Valuation Multiples by Industry
- EBITDA Multiple for Business Valuation by Industry | Sofer Advisors
- Business Valuation EBITDA Multiple: EBITDA Multiples for Small
- resources.smbinvestornetwork.com
- iconic.co
- EBITDA Multiples by Industry 2026 | Private Market Ranges